
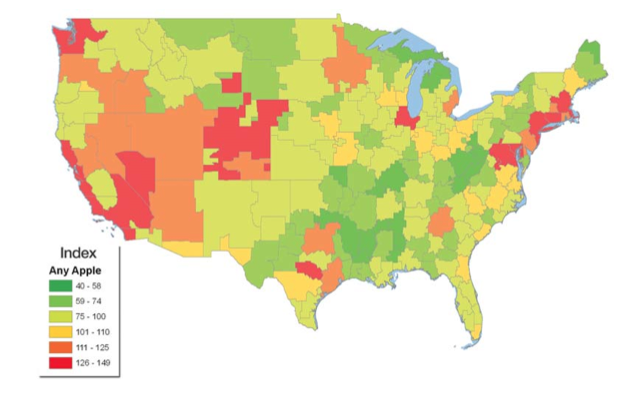
Ever wonder where the highest density of Mac users are? Well wonder no more, friends. The folks over at Experian Simmons did a little survey work to come up with the above map detailing where the highest concentration of Mac users in the US are located.
As you can tell above, Mac users tend to congregate in urban areas and not so much in the country. And if you happen to live in the Upper Peninsula of Michigan, well, then we just fell sorry for you. One of the more interesting tidbits gleaned from the survey is that 20% of Americans over the age of 18 own some type of Apple hardware, whether it be an iPod, an iPhone, or a Mac.
The top markets for Mac users are as follows:
- San Francisco-Oakland-San Jose, CA: With Silicon Valley and Apple headquarters located squarely within the market’s boundaries, it’s no surprise that the San Francisco-Oakland-San Jose DMA ranks number one in the nation for owning or using one of the core Apple products. Residents here are 49% more likely than the average American to own or use an iPod, iPhone or Mac computer.
- Boston, MA: Almost one-in-three adults in the Boston DMA (31.3%) own or use an iPod, iPhone or Mac computer making area residents 45% more likely than average to be Mac maniacs. And with 11 Apple stores located within the Boston DMA, residents never have to go far for their Apple fix.
- San Diego, CA: San Diego-area residents are 42% more likely than the average American to be toting around an iPod, chatting on an iPhone or computing on a Mac. In fact, 31.8% of the San Diego DMA’s 2.2 million adults are admitted Mac users.
- New York, NY: Anyone can tell you that iPhones are about as common in New York City as taxis, which supports the fact that there are roughly 4.9 million Mac-users in the New York DMA. Of the almost 16 million adults in the area, 30.4% use either an iPod, iPhone or Mac computer.
- Washington, D.C.: Residents of our nation’s capitol can agree on at least one thing: their love for Apple. D.C.-area residents are 39% more likely than average to be found listening to an iPod, chatting on an iPhone or tapping away on a Mac computer.
- Chicago, IL: The Chicago-area’s eight Apple stores should keep plenty busy serving the DMA’s 2.1 million adults who currently use one of the three core Apple products. An estimated 29.4% of adults in the Chicago DMA use iPods, iPhones or Mac computers, making them 36% more likely than average Americans to be Apple consumers.
- Denver, CO: An estimated 863,000 adults of the Denver DMA’s 3 million adult residents (29.1%) are Apple users, making Mile High City and surrounding area residents 35% more likely than average to use Apple’s iPods, iPhones and computers.
- Monterey-Salinas, CA: This upscale, coastal DMA located immediately south of the San Francisco DMA is home to barely a half million adults and only one (busy) Apple store. An estimated 151,000 adults in the area (28.1%) own or use iPods, iPhones and/or Mac computers. In fact, Monterey-Salinas residents rank 30% above average for being Apple users.
- Santa Barbara-Santa Marina-San Luis Obispo, CA: Aside from breathtaking views and sun-drenched beaches, the Santa Barbara DMA is home to 141,000 Apple users, 27.9% of area adults. Residents can take their pick of two Apple stores—one in Santa Barbara and another in San Luis Obispo—to fill all their Apple needs.
- Las Vegas, NV: Sin City-area residents are also 29% more likely than average to be users of Apple products. Approximately 408,000 of the DMA’s 1.5 million adults (27.9%) use either an iPod, iPhone or Mac, or all three.
via Experian
In a report issued Friday, Experian Simmons surveyed 206 so-called DMAs (designated market areas, or what we used to call “cities”) and identified those that have the highest concentration of Apple (AAPL) users.
The idea was to anticipate in what parts of the continental U.S. consumers were most likely to line up for the new iPad based on their known propensity to own or use iPods, iPhones or Macs.
The result is the color coded map shown above and the list of the top 10 markets pasted below (the numbers and the commentary is Experian Simmons’). To see full list, click here.

Sun, Apr 18, 2010
Featured, News